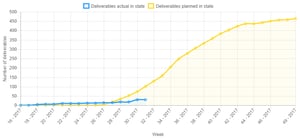
Eines der mächtigsten Werkzeuge im modernen Bauprojektmanagement sind S-Kurven - aber was genau sind S-Kurven?
S-Kurven sind mathematische Diagramme, die typischerweise zeigen, "wie viele Aufgaben geplant sind, um fertiggestellt zu werden (gelb im Diagramm unten)" im Vergleich zu "wie viele Aufgaben tatsächlich bis heute erledigt wurden (blau)" für die Laufzeit eines Projekts.
Die Verwendung von S-Kurven im Bauprojektmanagement bietet eine Vielzahl von Vorteilen, die ich kurz erläutern und zusammenfassen möchte:
- Eine geplante S-Kurve hilft, die Qualität des Projektfortschritts zu beurteilen. Wenn die Kurve schön gleichmäßig ansteigt und insgesamt zumindest grob wie ein "S" aussieht, dann scheint Ihr geplanter Zeitplan gut zu funktionieren.
Wenn die Kurve jedoch stattdessen Sprünge oder Plateaus aufweist, ist das nicht so gut. Sprünge deuten auf eine ungewöhnlich hohe Arbeitsbelastung hin, die Ihr Team möglicherweise nicht bewältigen kann. Plateaus deuten darauf hin, dass überhaupt keine Arbeit anfällt, was ebenfalls schlecht ist, wenn Sie ein Team bezahlen, das ohnehin vor Ort ist. - Wie Sie bereits gesehen haben, geben S-Kurven einen soliden Einblick in die bevorstehende Arbeitsbelastung. Daher helfen sie auch bei der Vorhersage, wann z.B. mehr als die üblichen Arbeitskräfte vor Ort benötigt werden.
- Das Hinzufügen der tatsächlichen S-Kurve in das Diagramm hilft Ihnen zu verstehen, wie Ihr Projektteam im Moment arbeitet, wie es in der Vergangenheit gearbeitet hat und wann genau die Dinge eine andere Wendung genommen haben als geplant.
- Dieser Soll-Ist-Vergleich "über die Zeit" hilft Ihnen, potenzielle Probleme früher zu erkennen, die Leistung Ihres Projektteams vorherzusagen und letztendlich Engpässe zu identifizieren, die in der Zukunft auftreten könnten. Dies hilft Ihnen zu verstehen, was in allen Phasen des Projekts geschieht.
Da S-Kurven ein so leistungsfähiges Werkzeug sind, haben wir bei Sablono sie kürzlich in unsere Lean Construction Management-Plattform aufgenommen. Und da sie auf unserer Plattform mit der umfangreichen Prozess- und Fortschrittsdatenbank verbunden sind, sind wir der Meinung, dass sie einen noch größeren Mehrwert bieten. Sie werden dazu beitragen, dass Ihr Bauprojekt nicht nur pünktlich, sondern auch im Rahmen des Budgets abgeschlossen wird. Hier ist der Grund:
- Wenn Sie den Ist-Zustand Ihres Projekts analysieren wollen, brauchen Sie vor allem genaue Daten, denen Sie vertrauen können. Sablono bietet Ihnen genau das, indem es Ihnen ermöglicht, Daten vor Ort auf strukturierte Weise mit einer unserer mobilen Anwendungen zu sammeln.
- Eines der Hauptmerkmale unserer Plattform ist die Möglichkeit, auf einfache Weise detaillierte Prozesse mit einer unbegrenzten Anzahl von Schritten einzurichten, die ausgeführt werden müssen, um eine Leistung zu erbringen. Sie und Ihr Team werden den Fortschritt auf der Grundlage dieser Prozessschritte melden. Und von nun an können Sie für jeden dieser Schritte separate S-Kurven betrachten.
Es war noch nie so einfach zu verstehen, welcher Teil Ihres Prozesses normalerweise Verzögerungen verursacht. Stellen Sie sich die enormen Möglichkeiten vor, die sich hieraus ergeben! Es wird eine große Hilfe sein, wenn es darum geht, Ihre Bauprozesse zu optimieren. Und sobald Ihr Prozess optimiert ist, werden Sie anfangen, Zeit zu sparen und somit die Projektkosten niedrig zu halten. - Da Sie den einzelnen Prozessschritten auch Teamverantwortlichkeiten zuweisen können, hilft die S-Kurve außerdem dabei, zu erkennen, welche (Sub-)Auftragnehmer gute Leistungen erbringen und welche nicht.
Sablono ist viel einfacher zu bedienen, als Sie vielleicht denken, und wir bieten nicht nur ein Support Center, sondern auch einen schnellen und freundlichen Kundensupport über unsere InApp-Chat-Funktionen.
.png?width=300&height=300&name=Heading%20(2).png)

.png?width=500&height=500&name=Heading%20(3).png)
