Planned vs Actual Dashboards
Understand how you’re progressing against your plan and adapt accordingly.
Understand delays and their implications
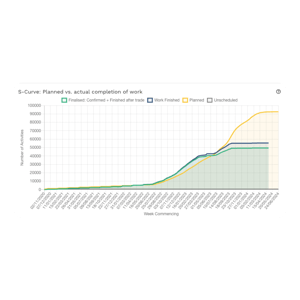
Automatically generate S-Curves and Planned-vs-Actual analysis to understand delays and their implications. See how any changes will impact other parts of your project and adapt accordingly.
Optimise your run rate
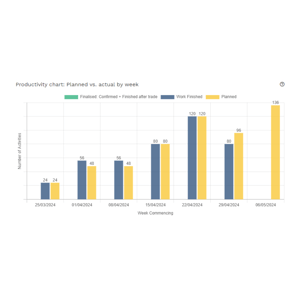
Track your run rate against the plan based on accurate progress data and use these insights to optimise your performance. Quickly detect who's falling behind so you can take action to fix it.
Get your personalised product demo
Get detailed construction intelligence
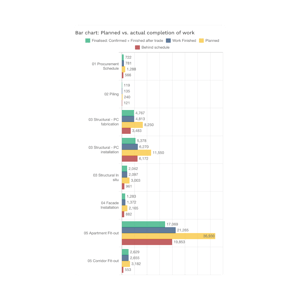
Intuitive charts and KPIs help you understand everything that's happening on your project. Drill down to areas, teams and even specific activities to understand your performance in detail.

Why use Planned vs Actual Dashboards?
Without Sablono
Lack of visibility into performanceManually generate insights
Unexpected delays
With Sablono
Always know how you're performingAutomated insights and intelligence
Prevent delays
How it works
Planned vs actual dashboards for all use cases
See all use casesElevate your project and business efficiency with Sablono Enterprise
Unlock the full potential of your project or business by leveraging Sablono's comprehensive suite of tools designed to streamline operations and maximize productivity. With features like unlimited users, custom SLAs, adaptable terms and conditions, and dedicated customer support, scaling across your company and supply chain has never been easier.Bring it all together
Sablono's Planned vs Actual Dashboard is just the beginning. Use it with Sablono's other payment valuation and intelligence features to get more done with less.FAQs
Planned vs Actual Dashboards help you understand how you're progressing against your plan and adapt accordingly. They also allow you to understand delays and their implications, enabling you to make informed decisions and prevent further delays.
The dashboards provide intuitive charts and key performance indicators (KPIs) that offer a detailed understanding of what's happening on your project. You can see the current status of your project and drill down to specific areas, teams, activities and dates to gain insights and evaluate your performance in detail.
Specific charts include:
-Planned vs Actual S-Curve
- Planned vs Actual Productivity Chart
- Planned vs Actual Bar Chart
Some specific KPIs include:
- No. of deliverables behind schedule
- No. of deliverables with open obstructions
- No. of deliverables with open quality issues
- No. of deliverables with info notes
The dashboards automatically generate S-Curves and Planned-vs-Actual analysis, which provide insights into delays and their impact on different parts of your project. This information allows you to adapt your plan accordingly and take proactive measures to address the delays.
By tracking your performance against the plan using accurate progress data, these dashboards enable you to quickly detect areas that are falling behind. With this information, you can take immediate action to fix any issues and optimise your jobsite for improved efficiency.
To make the most of Planned vs Actual Dashboards, you can start by planning your schedule in Sablono, down to the most granular level of detail. Then, track your performance against the plan using accurate progress data in your dashboard. Finally, adapt accordingly by leveraging the insights provided to optimise your job site.
Without Sablono, you may face a lack of visibility into your project's performance and have to manually generate insights. Unexpected delays can also occur without proper monitoring. With Sablono, you'll always understand how you're performing, gain access to automated insights and intelligence, and have the ability to prevent delays before they become significant issues.

