


Set clear KPI targets with your trades
Gain full visibility into the performance of your trades with detailed KPIs that help you identify where you need to improve. Easily view a breakdown table of KPIs by activity type to spot underperforming work packages and apply advanced filters to analyse average values across your activities.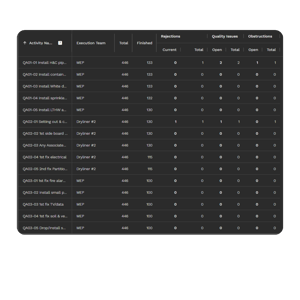
Get actual duration analytics
Compare planned vs. actual durations to understand how your timelines stack up against your schedule. Track key metrics like the "Available until Started Gap" and "Confirmation Gap" to gain insights into delays and improve workflow efficiency.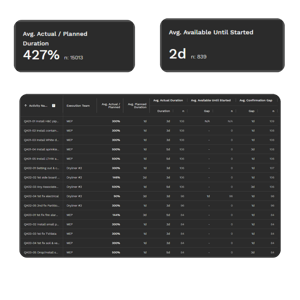
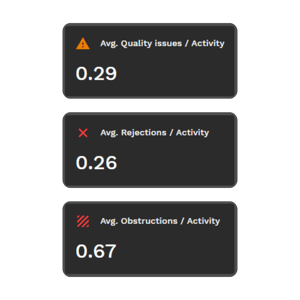
Access accurate quality and rejection analytics
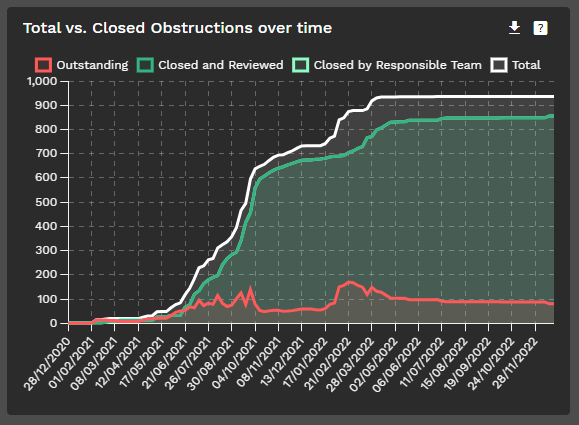
Monitor all quality issues and obstructions in one central view, including both open and resolved items. Access key metrics like average obstructions, quality issues per activity, and overall rejection rates to get to the root of quality issues.
Why use Activity Drilldown?
Without Sablono
Miss potential issuesLack performance clarity
Overlook quality control
With Sablono
Get to the root of issuesSet clear KPI targets
Access accurate quality analytics
Activity Drilldown for all use cases
See all use cases


- 01 Quality Dashboard
- 02 Deliverables Dashboard
- 03 Activity Drilldown
- 04 Run Rate and Performance Dashboard
Quality Dashboard
Gain deep insights into your subcontractors’ performance, spot quality trends, and address any recurring issues with data-driven discussions.
Deliverables Dashboard
Effortlessly communicate progress and expectations with a high-level milestone overview to ensure clarity with your subcontractors.

Activity Drilldown
Dive into detailed data to identify specific challenges and tackle root causes before they impact overall project success.

Run Rate and Performance Dashboard
Track each subcontractor’s performance against the project plan, identifying gaps and areas for improvement in real-time.

Bring it all together
Sablono's Activity Drilldown is just the beginning. Use it with Sablono's other payment valuation and intelligence features to get more done with less. Commercial Dashboard
Link costs directly to your site activities to see what the status of your project means for your finances.
Read More
Commercial Dashboard
Link costs directly to your site activities to see what the status of your project means for your finances.
Read More
 Commercial Look-Ahead
Unlock forecasted upcoming costs for your project based on your programme.
Read More
Commercial Look-Ahead
Unlock forecasted upcoming costs for your project based on your programme.
Read More
 Commercial Planned Works Valuation
Valuate actual achieved planned works at the push of a button and pay your subcontractors accordingly.
Read More
Commercial Planned Works Valuation
Valuate actual achieved planned works at the push of a button and pay your subcontractors accordingly.
Read More
 Baseline Scheduling
Transform your baseline into a detailed production plan and streamline the scheduling of more than 100,000 activities per project.
Read More
Baseline Scheduling
Transform your baseline into a detailed production plan and streamline the scheduling of more than 100,000 activities per project.
Read More
 Look-Ahead Planning
Update your look-ahead plan for the upcoming days, weeks and months based on reliable and highly granular progress data.
Read More
Look-Ahead Planning
Update your look-ahead plan for the upcoming days, weeks and months based on reliable and highly granular progress data.
Read More
 Planned vs Actual Dashboards
Understand how you’re progressing against your plan and adapt accordingly.
Read More
Planned vs Actual Dashboards
Understand how you’re progressing against your plan and adapt accordingly.
Read More